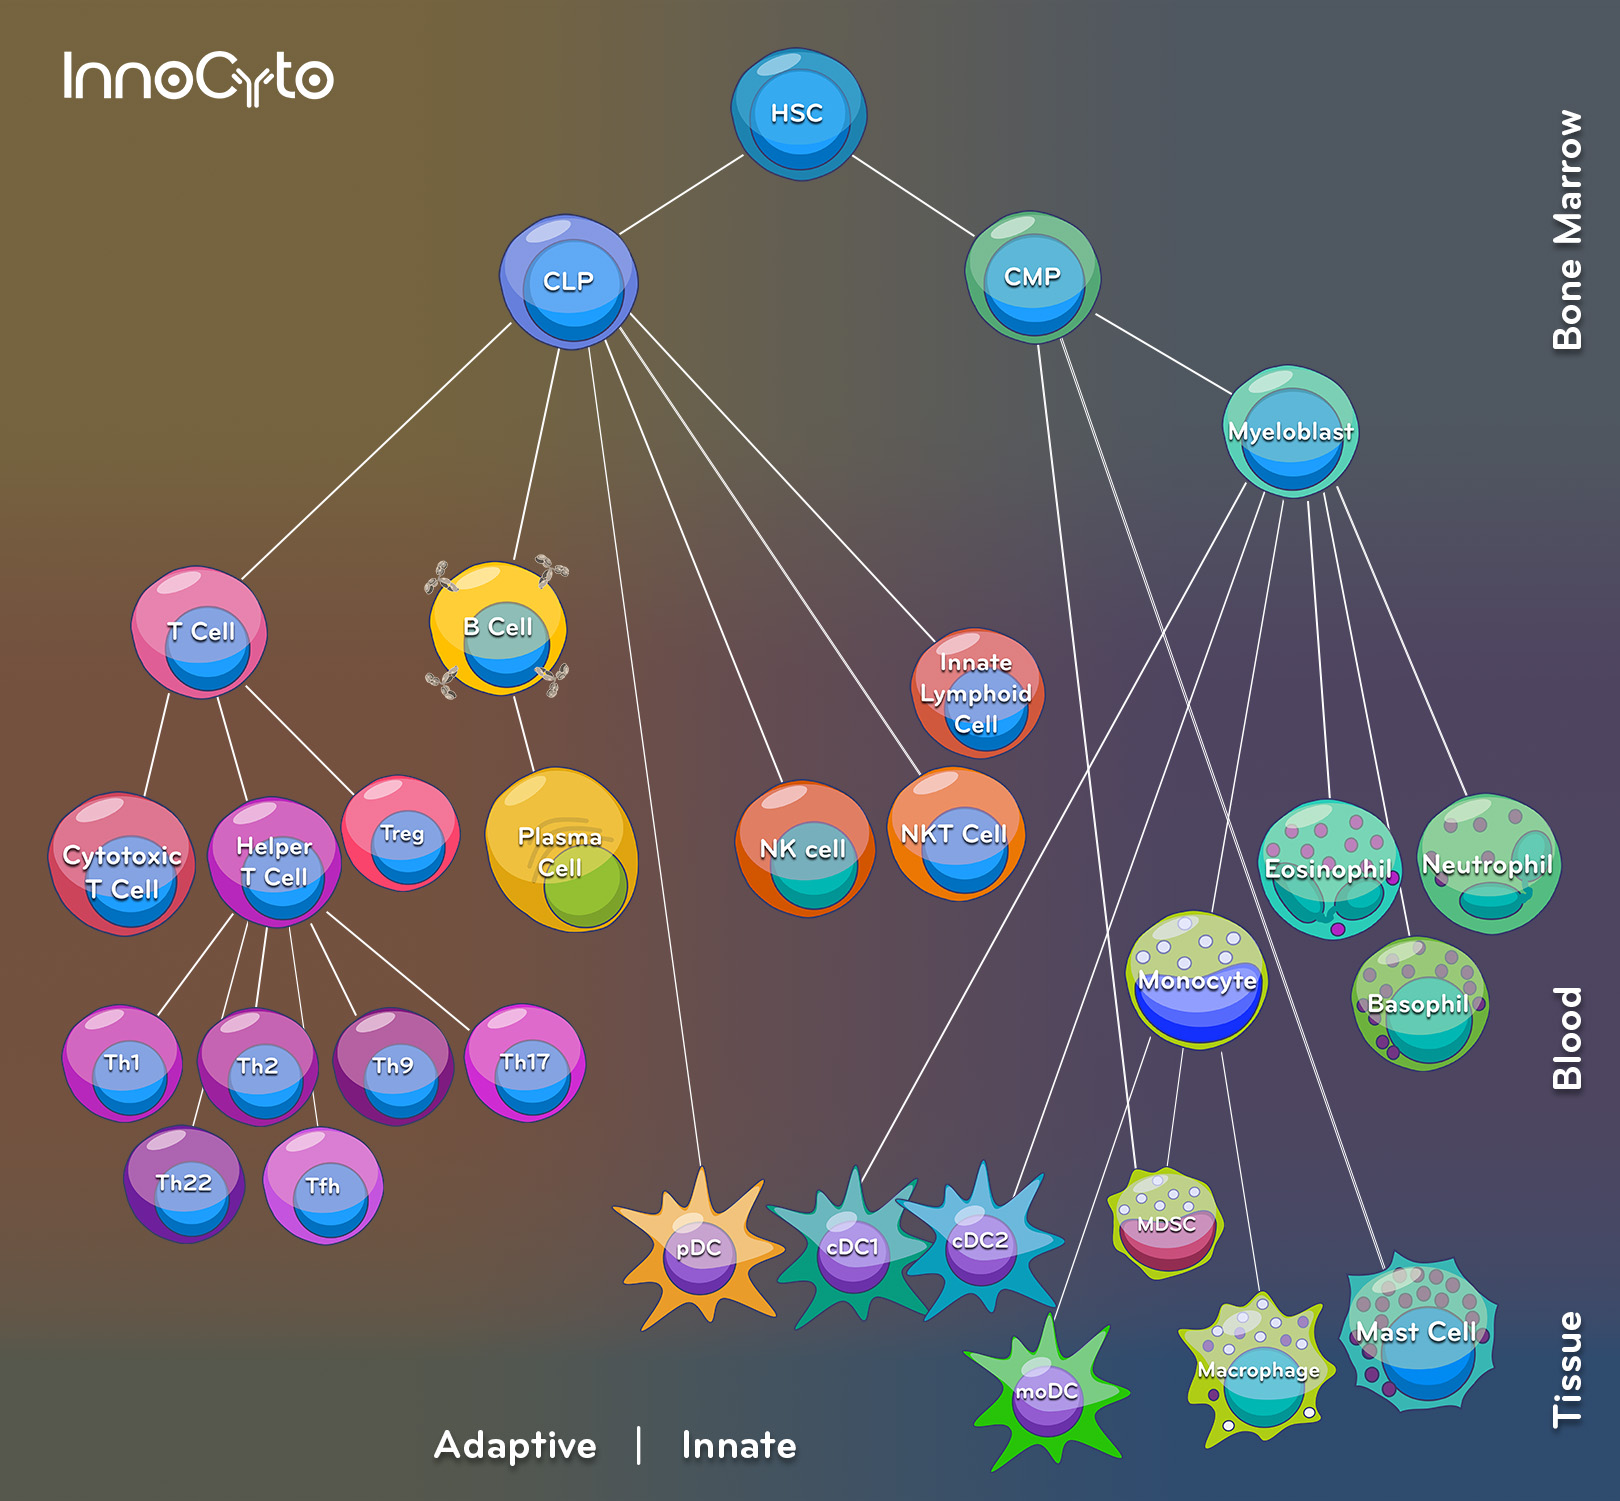
The schematic illustrates the hierarchical differentiation of the hematopoietic system, beginning with hematopoietic stem cells in the bone marrow that bifurcate into common lymphoid and common myeloid progenitors. The common lymphoid progenitor gives rise to adaptive immune populations, including T cells (with further specialization into cytotoxic, helper, regulatory, and multiple effector subsets such as Th1, Th2, Th17, Tfh, etc.) and B cells, which can differentiate into antibody-secreting plasma cells. The common lymphoid progenitor also differentiates into innate-like lymphocytes such as NK, NKT, and innate lymphoid cells. In parallel, the common myeloid progenitor generates innate immune cells through intermediates like the myeloblast, which mature into granulocytes (neutrophils, eosinophils, basophils), conventional dendritic cell subsets, and monocytes, who then further mature into macrophages, dendritic cells, and myeloid-derived suppressor cells. The diagram emphasizes both lineage commitment and functional organization, spatially separating adaptive and innate immunity while also highlighting their developmental interconnections and distribution across bone marrow, blood, and peripheral tissues.